
Low-noise preamplifier selection guide
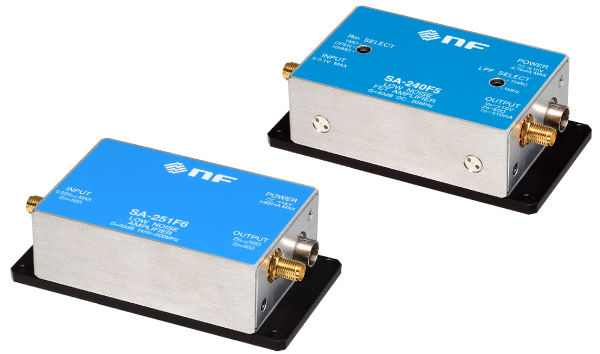
Single-ended input type
- Reliably amplify a wide range of voltage signals between sub-µV and several mV
- Lineup of models supporting a wide frequency range between DC and up to 500MHz
- The most suitable model can be selected according to the signal source resistance.
-
Information
-
Measurement example
-
Customization
Information
Lineup
| Input type | Gain | Bandwidth | Input impedance | Input Voltage noise | Input current noise | Noise figure | |
|---|---|---|---|---|---|---|---|
| SA-200F3 | Single-ended | 40dB | DC to 800kHz |
1kΩ/ 10kΩ/ 100kΩ |
0.5nV/√Hz | 2.2pA/√Hz | - |
| SA-220F5 | 46dB | 1kHz to 80MHz |
1MΩ | 0.5nV/√Hz | 200fA/√Hz | - | |
| SA-240F5 | 40dB | DC to 20MHz |
1MΩ/ 100MΩ/ OPEN |
1.2nV/√Hz | 5fA/√Hz | - | |
| SA-230F5 | 46dB | 1kHz to 100MHz |
50Ω | 0.25nV/√Hz | 5pA/√Hz | 0.6dB | |
| SA-250F6 | 40dB | 100Hz to 250MHz |
50Ω | 0.25nV/√Hz | 5pA/√Hz | 0.6dB | |
| SA-251F6 | 40dB | 1kHz to 500MHz |
50Ω | 0.25nV/√Hz | 8pA/√Hz | 0.9dB |
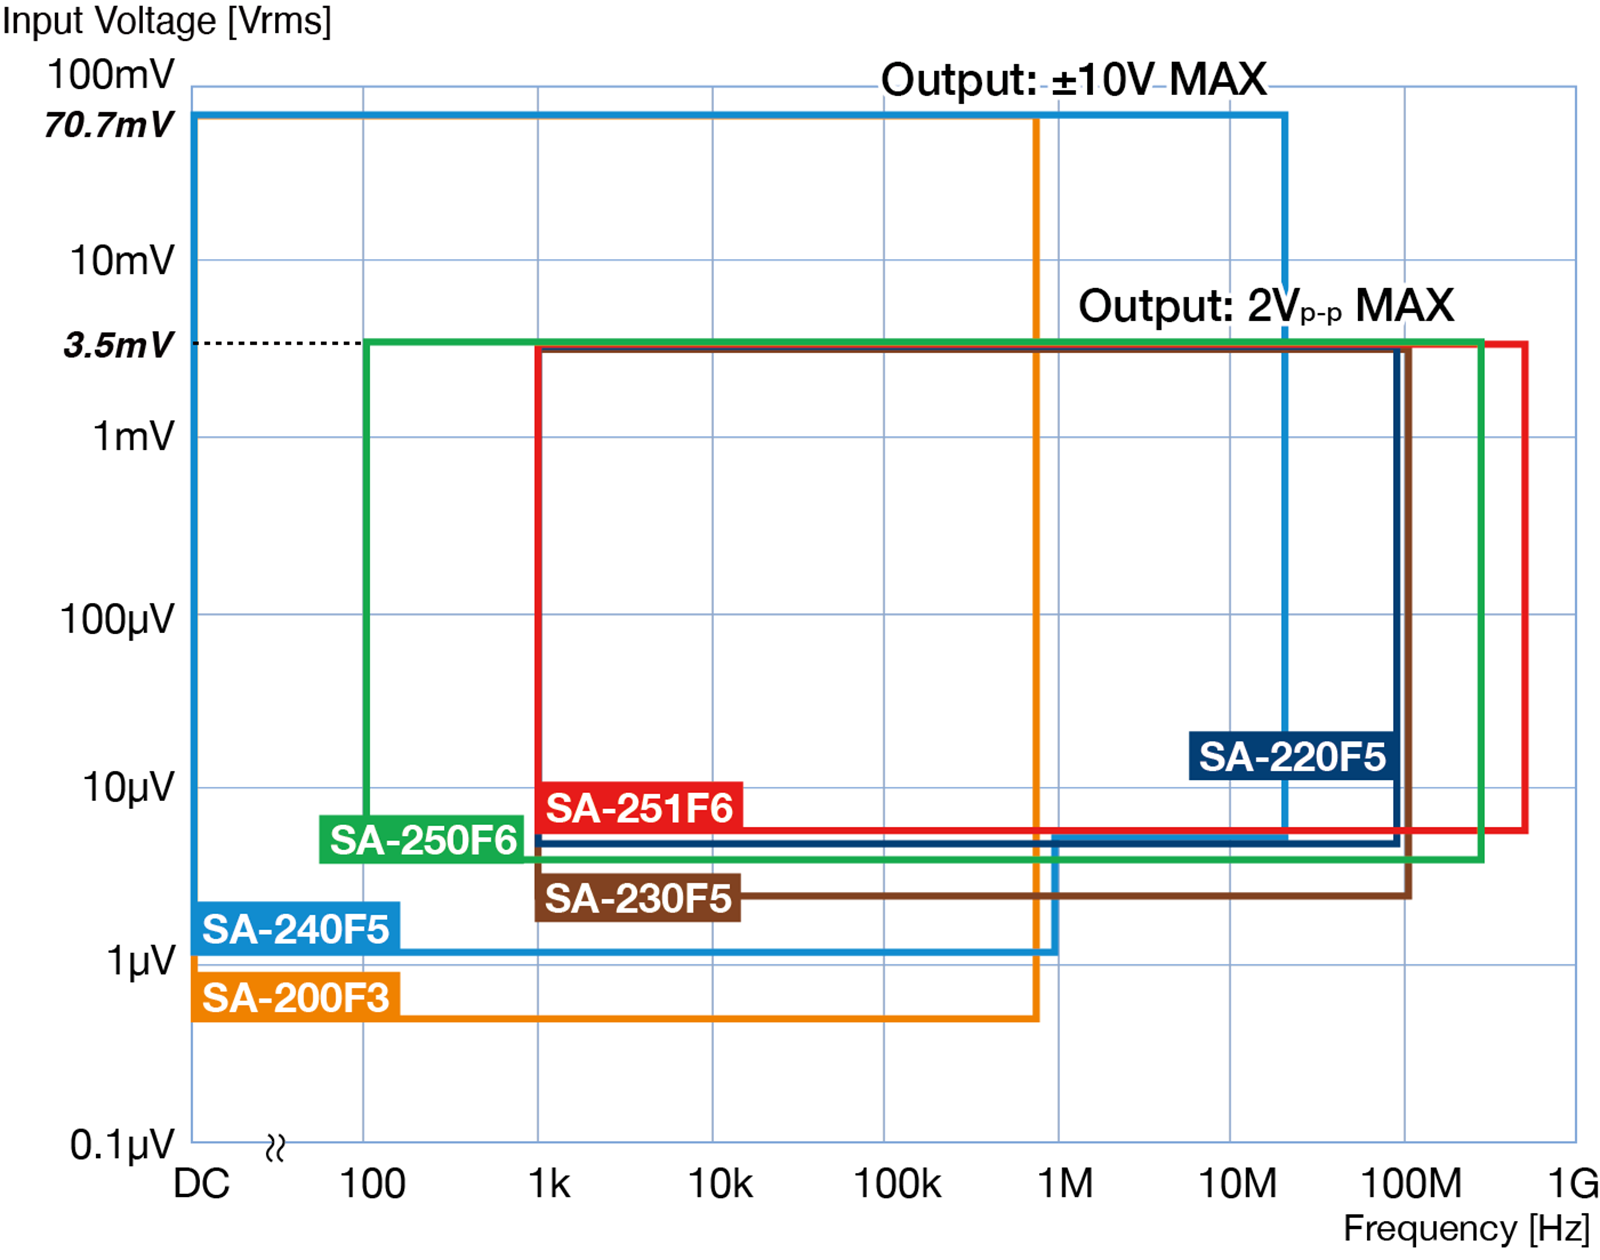
Input voltage - Frequency response
The model line-up supports a wide voltage input range. Includes extremely small voltages of less than 1 μV.
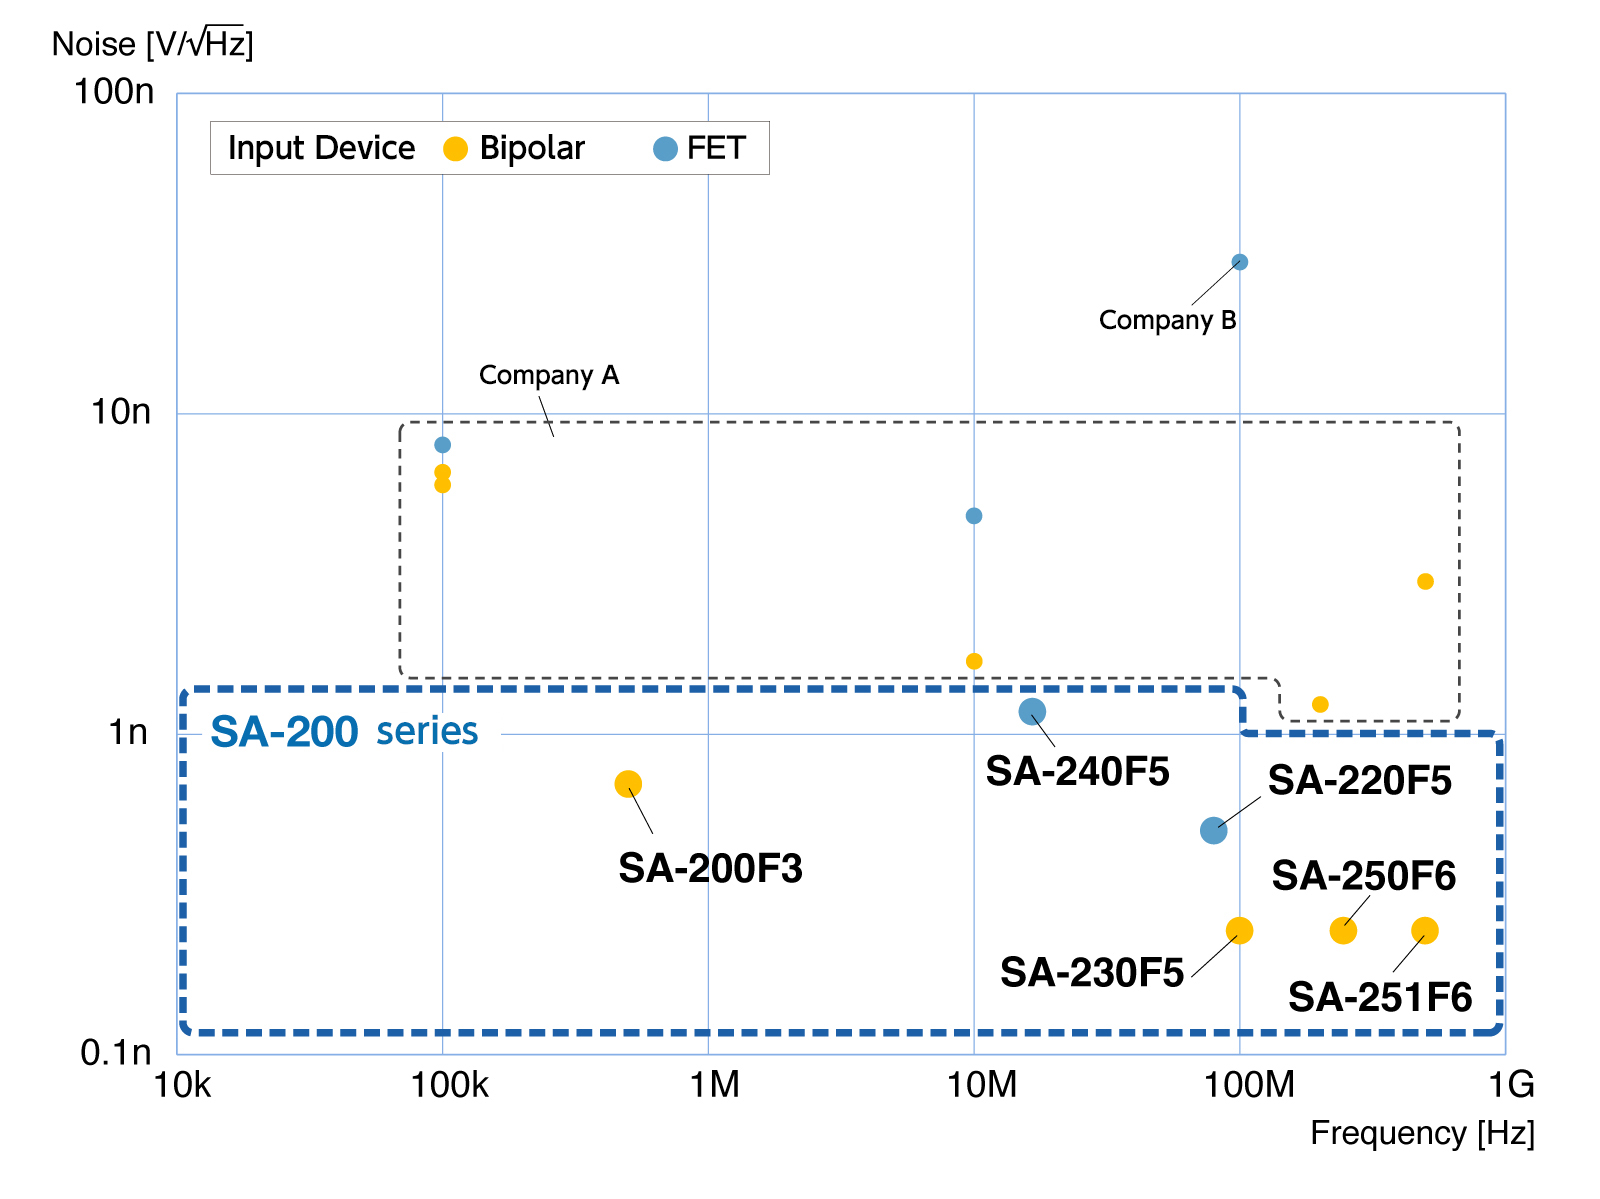
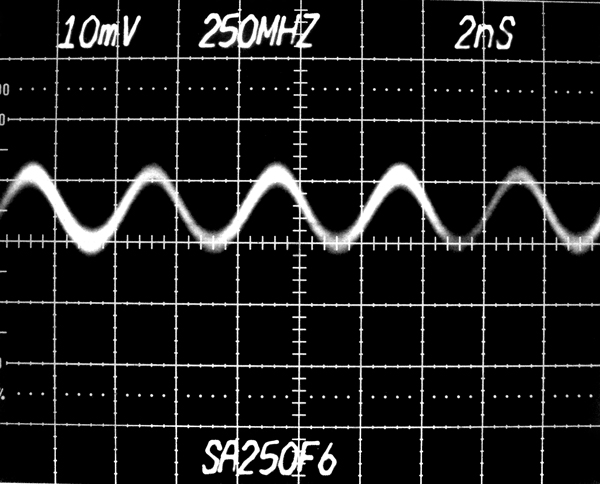
Output noise - Frequency response
Supports models with frequency ranges up to 500MHz. Achieves low noise specifications compared to competitors.
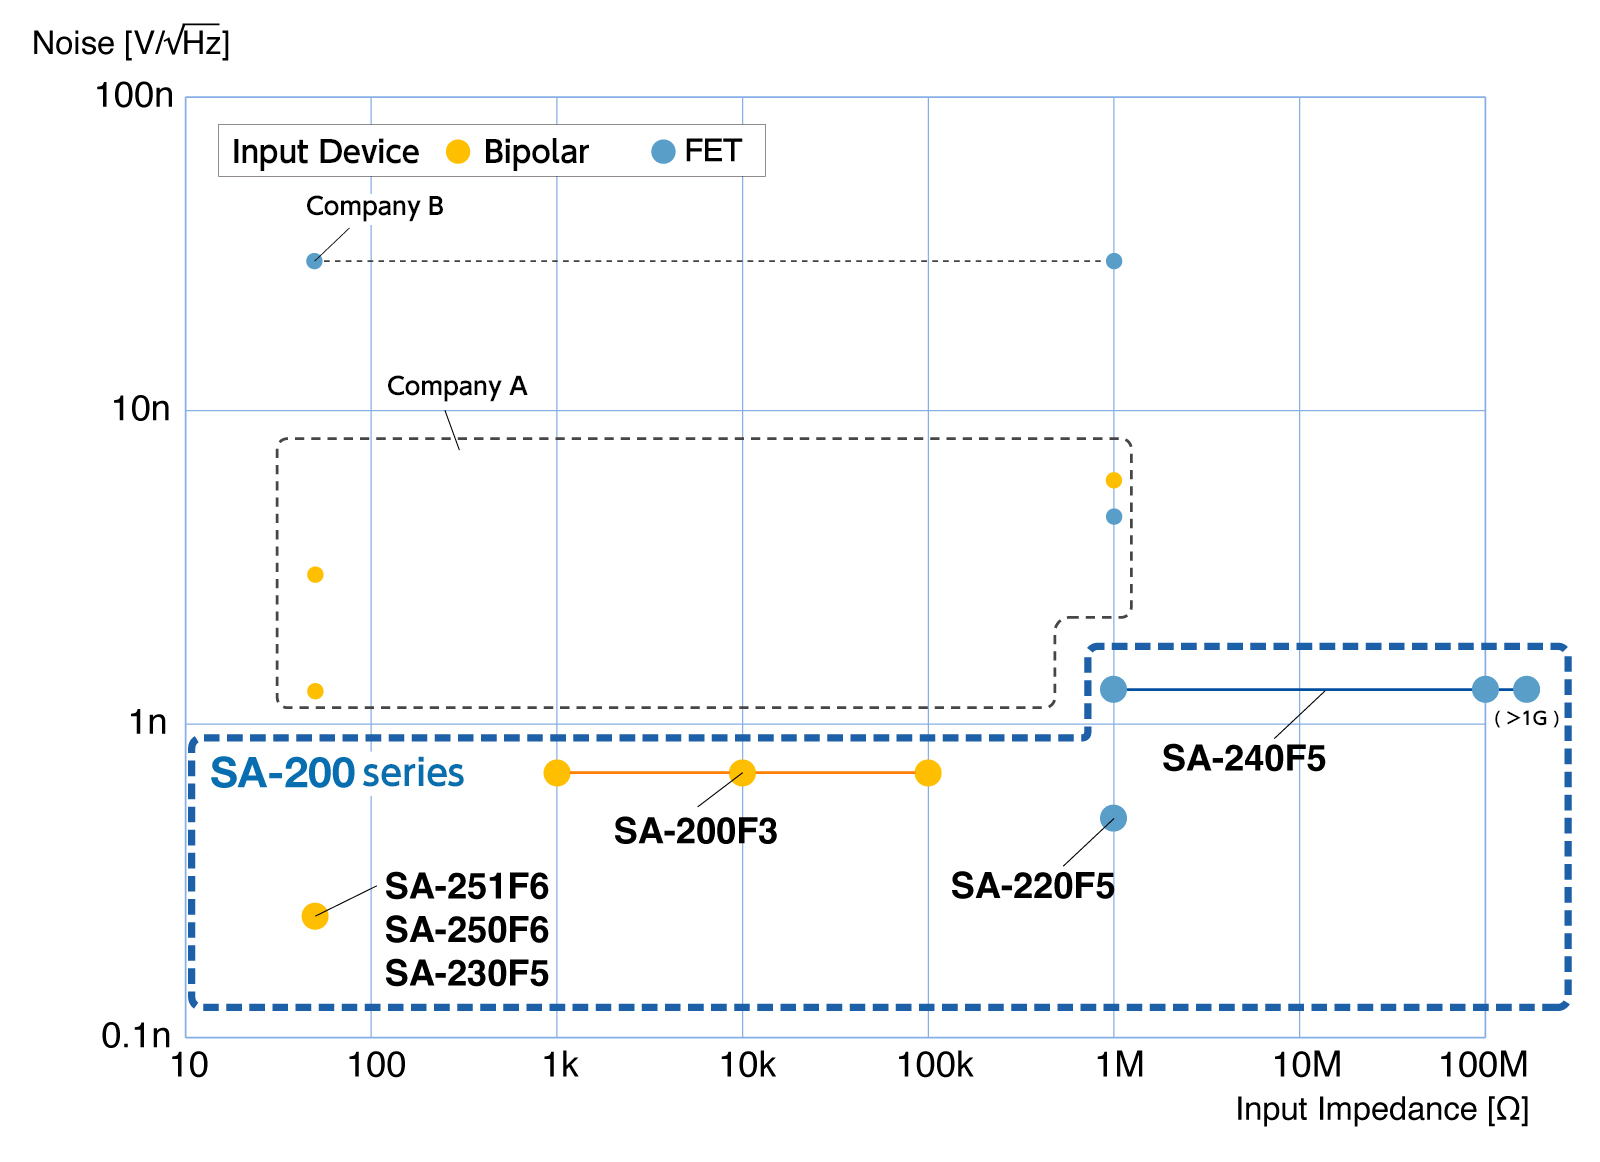
Output noise – input impedance characteristics
An amplifier suitable for the signal source resistance of the sensor can be selected. Achieves low-noise signal output.
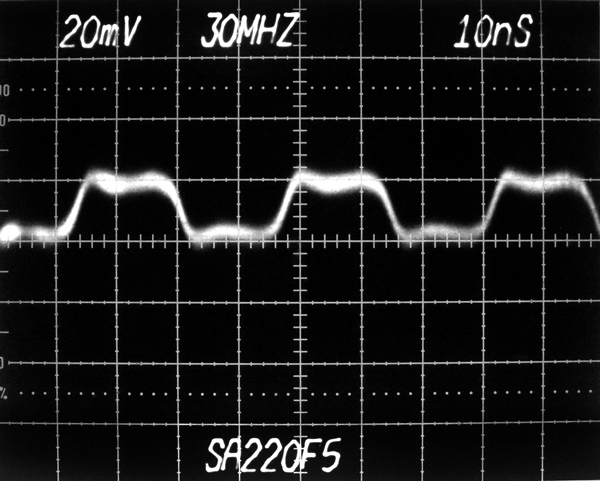
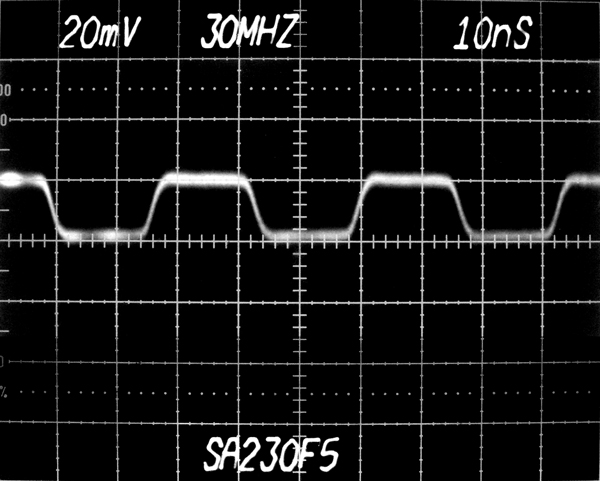
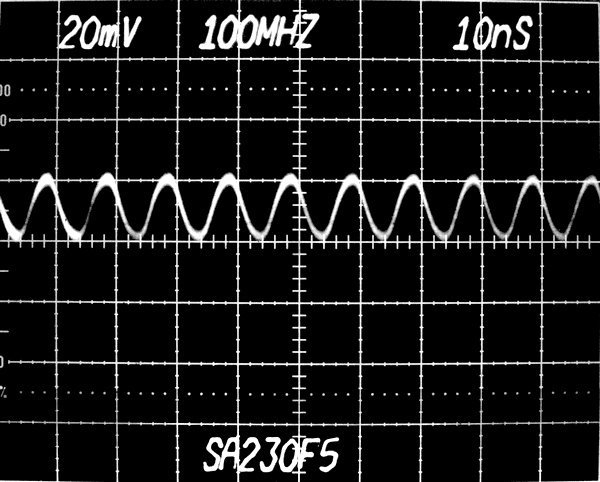
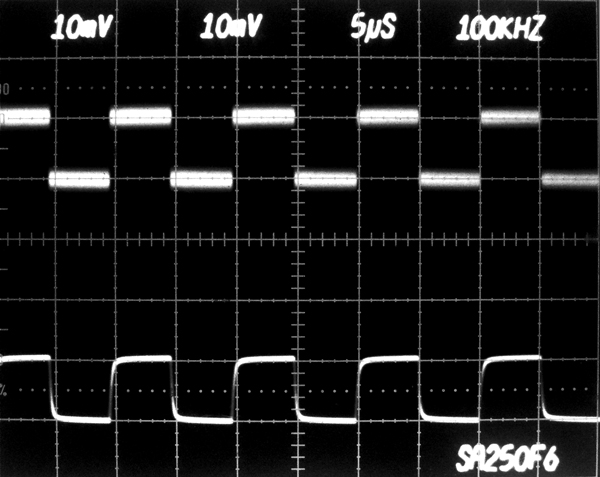
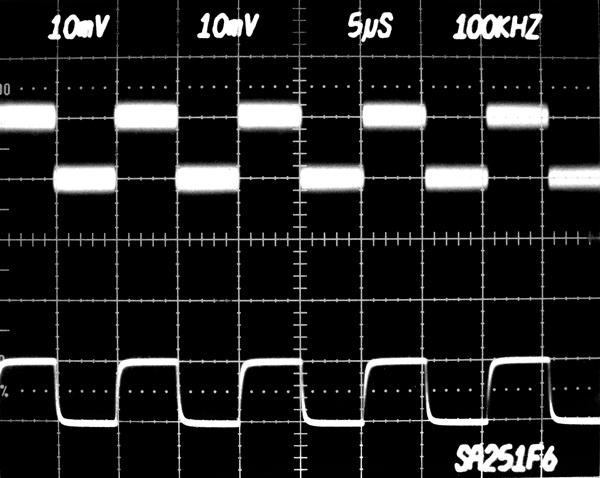
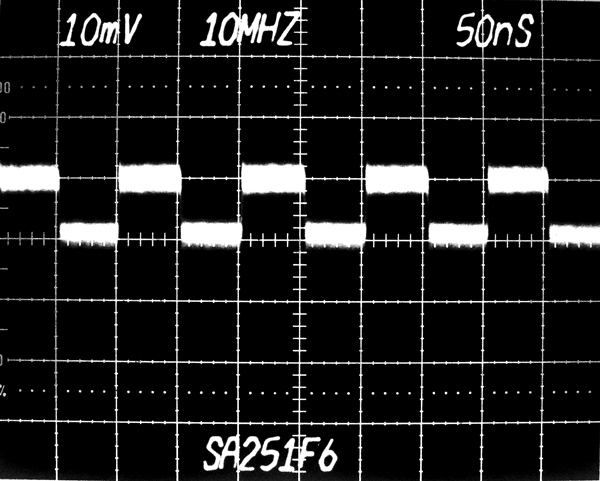
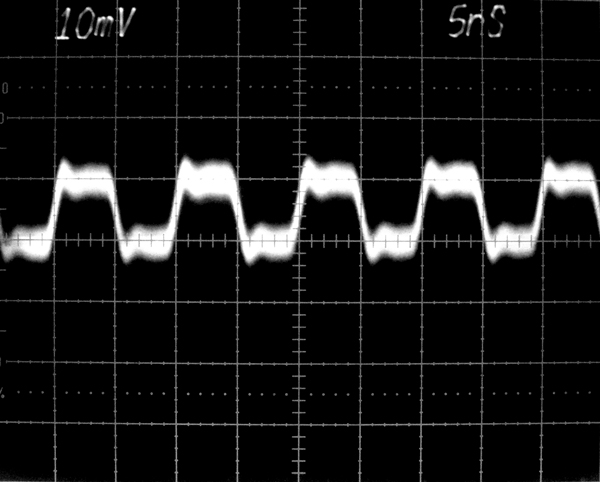
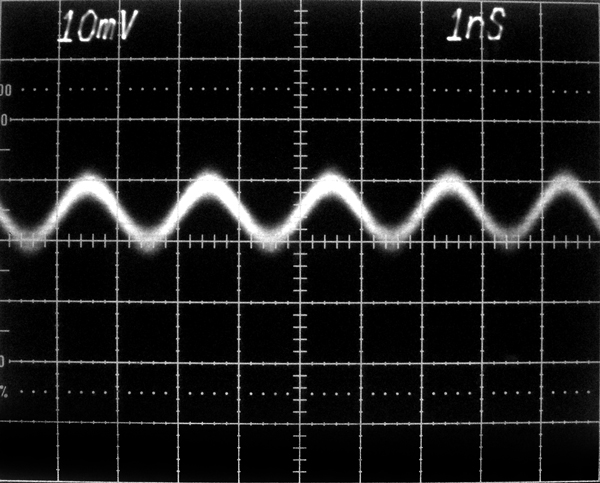
Pulse response
Output waveform comparison at 100μVp-p square wave input
- Upper waveform: Amplifier output
- Lower waveform: Output after passing through amplifier output latter-stage LPF (1MHz) (reference)
SA-200F3 (DC to 800kHz, 0.5nV/√Hz)
SA-220F5 (1kHz to 80MHz, 0.5nV/√Hz)
SA-230F5 (1kHz to 100MHz, 0.25nV/√Hz)
SA-240F5 (DC to 20MHz, 1.2nV/√Hz)
SA-250F6 (100Hz to 250MHz, 0.25nV/√Hz)

SA-251F6 (1kHz to 500MHz, 0.25nV/√Hz)
Measurement example
Output noise density measurement of low-noise power supplies
Measurement of the output noise density of the low-noise power supply LP5394
using a signal analyzer.
Better measurement results were obtained by using the SA-200 series.
Measurement result of signal analyzer (equivalent input noise 7.6nV/√Hz)
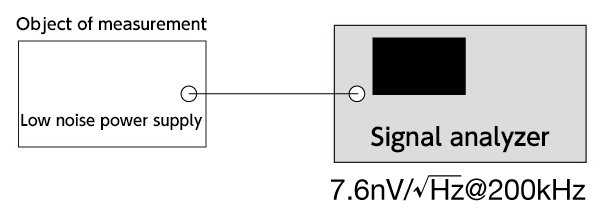
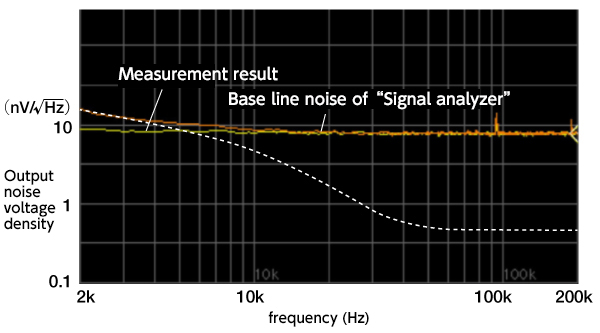
True output noise density cannot be measured due to noise generated by the signal analyzer
Measurement result of signal analyzer and SA-230F5 (input conversion noise 0.25nV/√Hz)
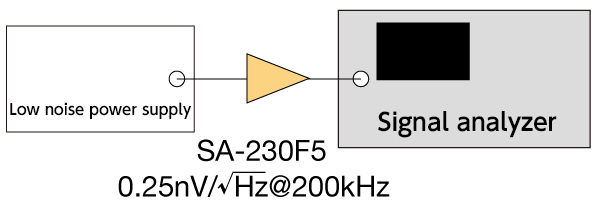
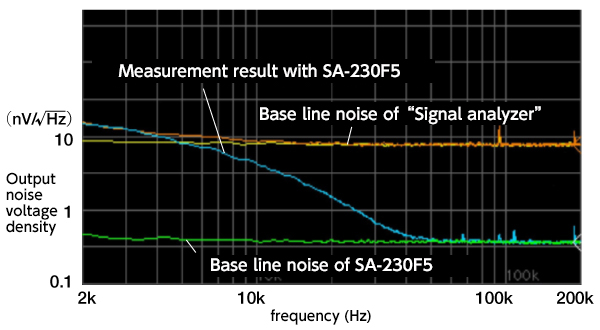
The sensitivity was improved by more than 20 times and measurement between 2 kHz and 40 kHz became possible.
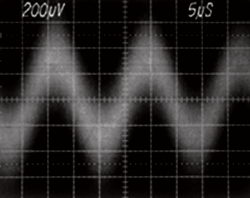
Challenging the signal detection limit (µV real-time signal)
Small signals amplified by the SA series are observed with an oscilloscope.
SA-200F3
- Input signal: 5μVp-p, sine wave
- Oscilloscope: 1MHz bandwidth
- LPF: Connected after the amplifier and set a cutoff frequency about 5 times the signal frequency*
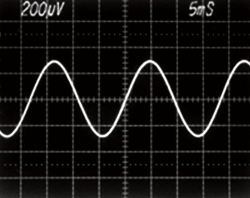
LPF=300Hz
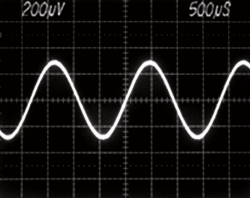
LPF=3kHz
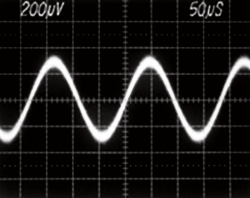
LPF=30kHz
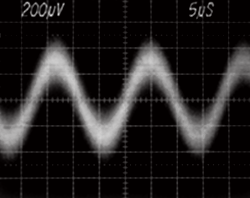
LPF=300kHz
Real-time signals of 5μVp-p observed
Waveform without LPF
*Using an appropriate LPF can reduce overall noise as shown above.
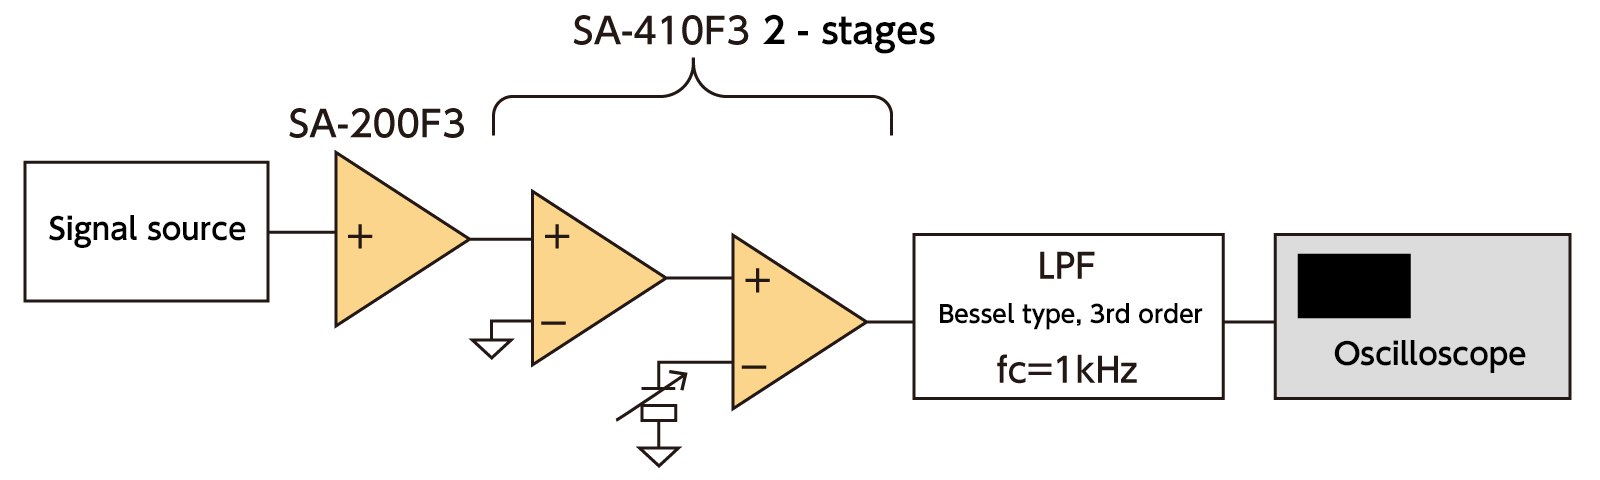
Challenging the signal detection limit (nV repetitive signal)
Connect multiple SA series units and observe using the averaging function of the oscilloscope.
Block diagram
Results
- Input: 4nVp-p@55Hz, Pulse width: 1.82ms
- LPF measurement bandwidth: 1kHz
- Averaging process: 10,000 times
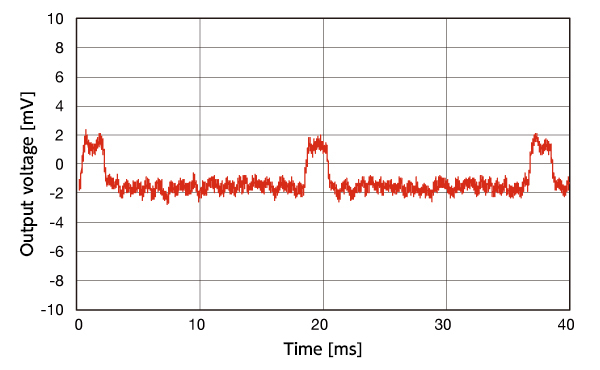
4nVp-p signal detected
Customization
Bandwidth modification
- Change frequency response (extend low and high cutoff frequencies)
- Change gain (e.g. 46d to 40dB)
- Reduced overload recovery time
- Multi channel Multi-channel low-noise system
Change frequency response
| Standard | Customized | |
|---|---|---|
| SA-220F5 | 1k to 80MHz | 1k to 130MHz |
| SA-230F5 | 1k to 70MHz | 1k to 110MHz |
| SA-240F5 | DC to 20MHz | DC to 40MHz |
Reduced overload recovery time (for MRI/NMR)
In MRI/NMR, waveforms are observed immediately after a change from a large signal
input to a small signal.
Therefore, a short overload recovery time is required
for the amplifier to transition from a large signal input saturation state to a
normal state.
Customized products with greatly reduced overload recovery time are
available.
Customization based on SA-250F6
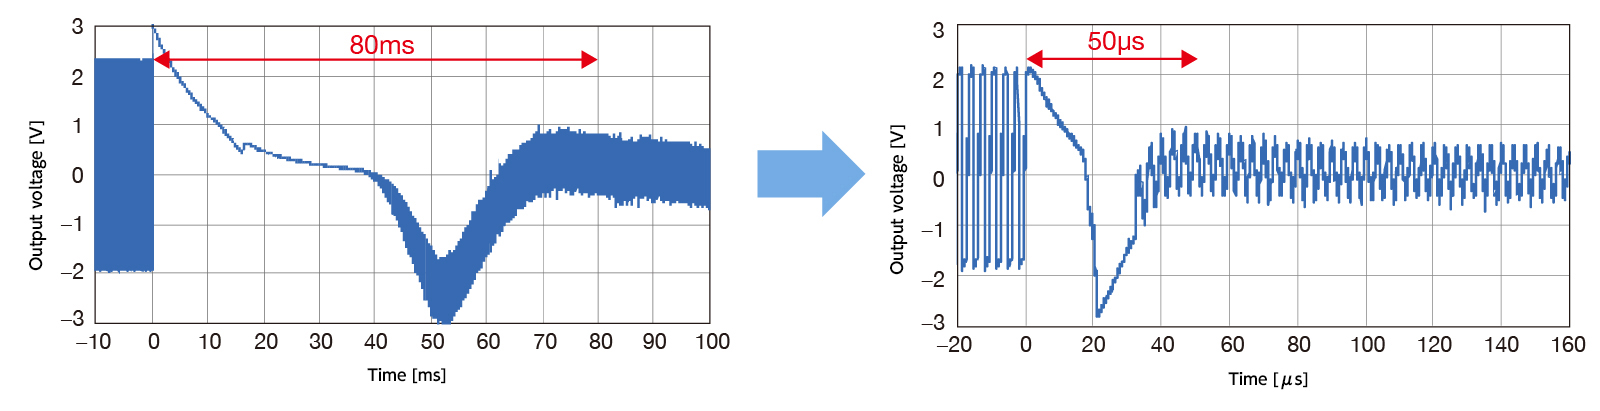
- Overload recovery time: 80ms → 50μs
- Frequency response: 100Hz to 250MHz → 20kHz to 10MHz
- Equivalent input noise voltage density: 0.5nV/√Hz@2MHz (unchanged)
- Size: 50 x 40 x 11.5 mm (75% volume reduction)
Significant time reduction from 80ms to 50μs
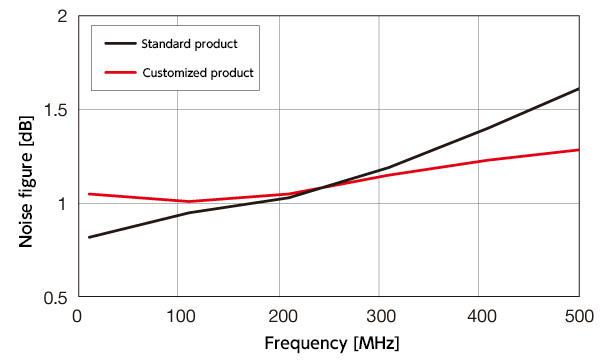
Customization based on SA-251F6
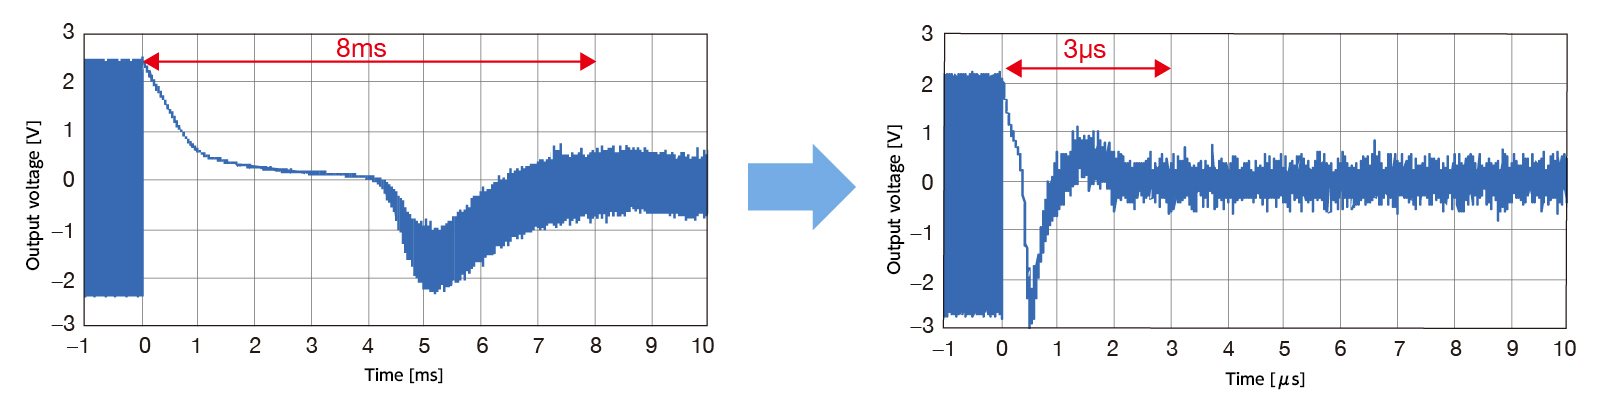
- Overload recovery time: 8 ms → 3 μs
- Noise figure: 1.8 dB → 1.3 dB (improved at 500 MHz)
- Frequency response: 1kHz to 500MHz → 3MHz to 500MHz
Significant time reduction from 8ms to 3μs and the noise figure also improved