
 |
Measurement, Analysis
and Simulation |
 |
|
|
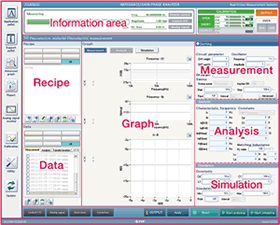
| Information Area |
|
Guidance message, estimated time until completion of
measurement (remaining time), output of the measurement
signal, eternal communication and input/output, status
of ZGA5920 output, status of open/short correction and
equalization, and detection of excessive input.
|
 |
  |
|
Tool Pallet
An operation pallet that has functions for controlling
the software as a whole
Application Pallet
Support Pallet
Graph Details
Report
Analog signal input monitor
Calibration
Configuration
Update
|
 |
 |
 |
Setting
the measurement, analysis and simulation parameters |
 |
| Measurement Operation Area |
Display of the pallet:
control I/O, analog signal input, auto execution, and
correction condition settings
|
 |
Measurement, Analysis and
Simulation |
 |
|
   |
Preparation |
|
 |
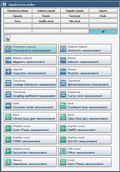
From your first use of ZGA5920, the measurement
objects and measurement parameters are easily
selected on the Application Pallet. The
measurement, analysis and simulation windows can
be directly activated whenever the power is
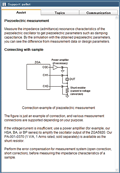
turned on after that. Measurement support
information is provided on the Support Pallet.

|
 |
 |
| Application Pallet |
Support Pallet |
| Provides measurement
support information |
|

   |
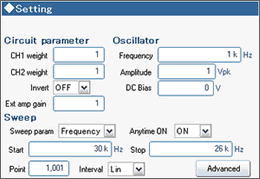
Setting the
measurement conditions |
|
 |
Input the values in the
displayed measurement parameter field.
|
 |
 |
Unit setting is easy on
the number input pallet. |

   |
Graph display
of the measurement result |
|
|
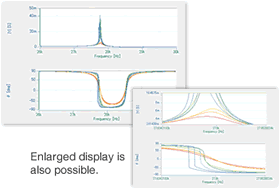
he
measurement results are displayed as a graph. “Graph
Details” lists all the types of graphs that can be
used to display the measurement results. It’s also
equipped with a graph overwriting function and a marker for
reading the values. |
 |
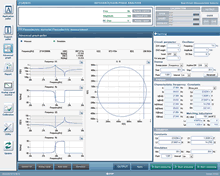
Graph details
|
 |

   |
Analysis |
 |
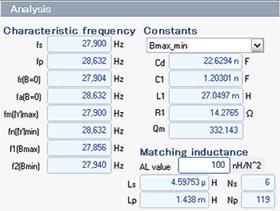
Based on the measurement results, the parameters specific to
the measurement object are analyzed. For piezoelectric
materials, response frequencies such as the resonance
frequency are extracted and the piezoelectric constant is
estimated. It’s possible to estimate the matching
inductance between the piezoelectric transducer and the
driving circuit.
|
 |

   |
Simulation
|
 |
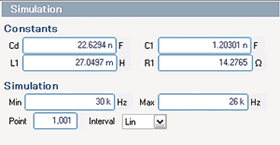
Simulation can be
executed by freely changing the parameters. The
characteristics are displayed on the graph. |
 |

   |
Report output
|
 |
The measurement results
are saved as a printable PDF. It’s possible for the
user to create a PDF template file. The characteristic graph
can be saved as a BMP file. |
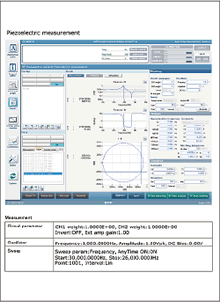
Report output in PDF format |
 |
Data Administration |
 |
|
   |
Recipe |
 |
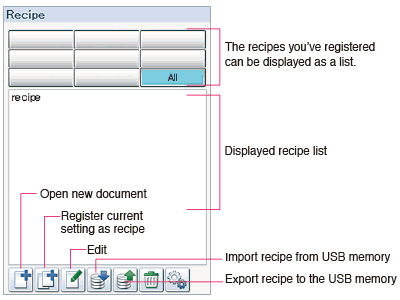
This is a function for
administering the measurement conditions of the application.
The measurement, analysis and simulation conditions and
correction values can be pre-registered for each specimen to
be measured, which makes it unnecessary to set the
conditions for each measurement. |
| |
 |

   |
Data |
 |
his is a function for administering
the results of measurement, analysis and simulation. |
| |
 |

- Recipe, measurement and analysis data, simulation
data, and analog input data are saved in XML format,
and transfer function data are saved in TXT format.
- The import and export of various data is possible by
using the dedicated utility software or USB memory.
|
|